Introduction
SNGREP is a powerful tool for real-time monitoring and analyzing SIP signaling and RTP streams. This documentation outlines how to use SNGREP to diagnose communication issues, capture packets, and export data for detailed analysis.
Features:
- Captures SIP packets from devices or read from PCAP file
- Supports UDP, TCP and TLS (partially) transports
- Allows filtering using BPF (Berkeley Packet Filter)
- Saves captured packets to PCAP file
1.- SIP Traffic Configuration and Capture
Step 1:
SSH into your VitalPBX server, and start SNGREP (with root privileges) by running the following command:
sngrep
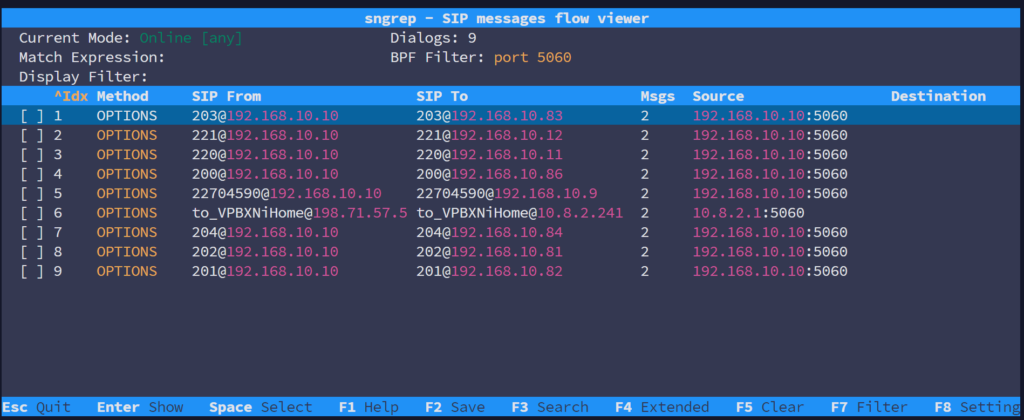
Step 2:
To filter SIP traffic, you can limit the capture to a specific port by running the SNGREP command with the desired port. For example, to monitor port 5060 (the default SIP port), you can run:
sngrep port 5060
Step 3:
Select the Appropriate Network Interface: If your server has multiple network interfaces, make sure to choose the correct one within the SNGREP interface to capture only the relevant traffic. Alternatively, you can specify the interface directly when starting SNGREP by using the -d flag.
For example, to monitor traffic on the eth0 interface, run:
sngrep -d eth0
Step 4:
Analyze the Captured Traffic:
- Identify SIP messages (INVITE, ACK, BYE, etc.).
- Use interactive filters within SNGREP to highlight specific sessions.
2.- RTP Traffic Capture and Analysis
Step 1:
You can start SNGREP normally and press F7 to open the Filter Options menu, which allows you to filter for specific traffic types such as INVITE, REGISTER, OPTIONS, etc.
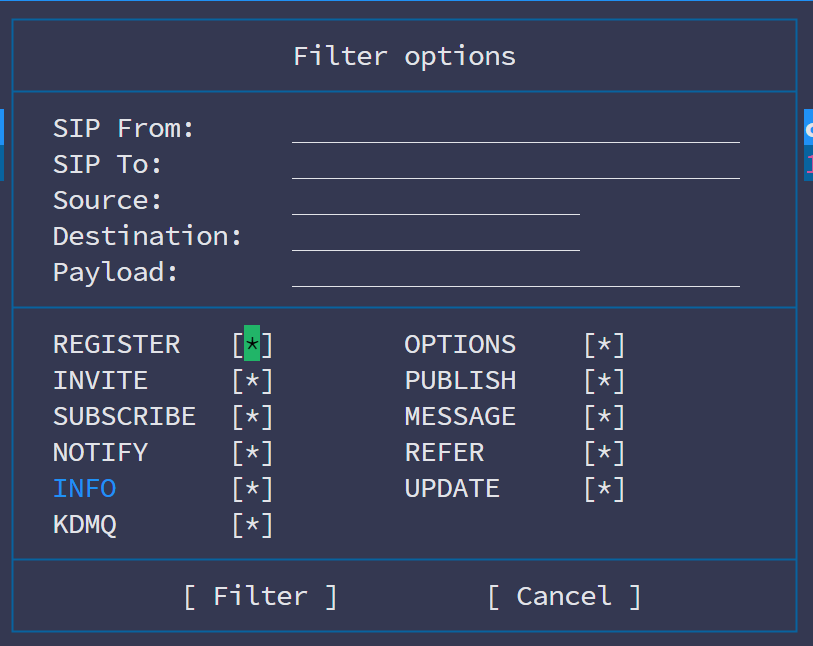
This menu option in SNGREP allows you to apply specific filters to narrow down the captured SIP traffic, making analysis more targeted and efficient. Here’s a breakdown of its utility:
- SIP From / SIP To: Filter messages based on the originating or destination SIP address. This is useful when troubleshooting specific calls or users.
- Source / Destination: Filters traffic by specific IP addresses or ports, helping you isolate sessions from particular endpoints or networks.
- Payload: Allows you to search for specific keywords or content within the SIP message body.
At the bottom:
- REGISTER, INVITE, OPTIONS, etc.: These toggle options let you include or exclude specific SIP message types. For example:
- REGISTER: Useful for troubleshooting registration issues.
- INVITE: Focuses on call setup issues.
- OPTIONS: Verifies SIP connectivity and maintenance messages.
Practical Use
This menu is especially valuable when:
- Investigating Registration Problems: Use the REGISTER filter to isolate messages related to user registration.
- Analyzing Call Setup Failures: Enable INVITE and 200 OK to check call negotiations.
- Monitoring Maintenance: Use OPTIONS or INFO to track SIP maintenance messages.
Step 2:
Enable RTP Capture: To start SNGREP with RTP traffic capture, initiate the tool using the -r flag. This is useful for inspecting audio quality.
sngrep -r
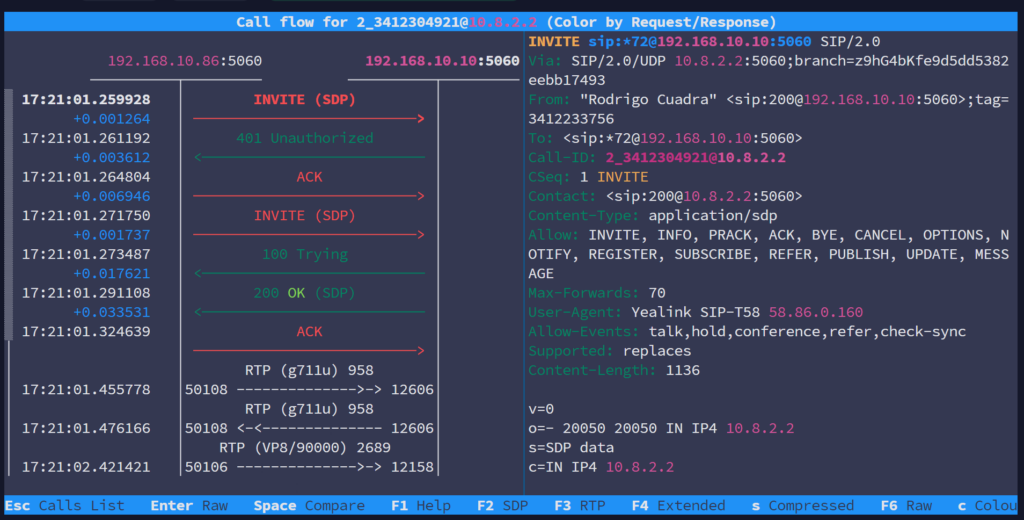
Press F7 and Configure Filters:
- In the Filter Options menu:
- Leave SIP From and SIP To blank unless you are targeting specific SIP addresses.
- Focus on enabling relevant methods, such as INVITE (for call setup) and INFO (for in-call events).
- RTP packets do not appear as separate SIP methods but are associated with the INVITE session in SNGREP.
- In the Filter Options menu:
Verify RTP in the Session View: During Calls:
- Open an INVITE method of the desired live call.
- Press F3 to check RTP traffic of the selected call.
Step 3:
If SNGREP does not provide sufficient detail about packet loss or jitter, export the session to a PCAP file. From the SNGREP interface, press F2 and choose a location to save the capture.
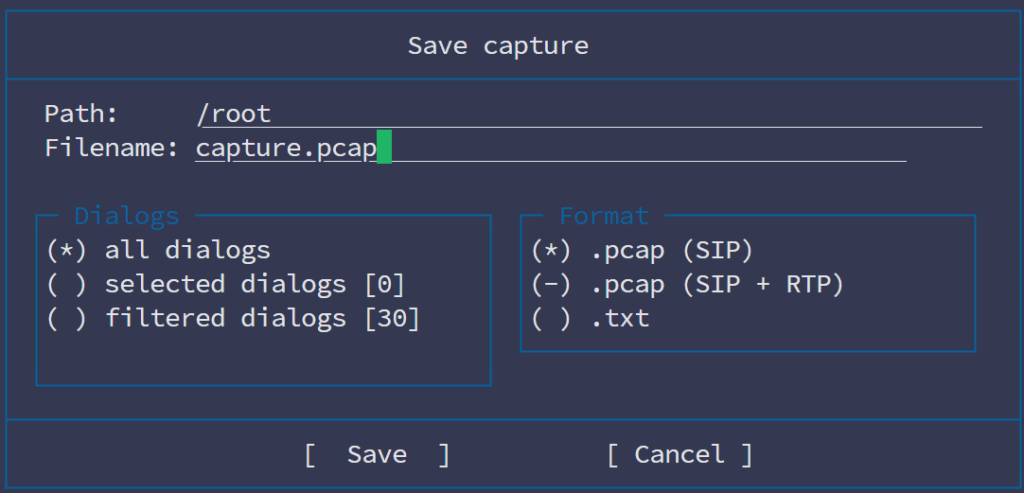
- Open the PCAP file in Wireshark, which offers detailed RTP analysis:
- Go to Telephony > RTP > Stream Analysis.
- Look for metrics like packet loss, jitter, and round-trip time.
3.- Common Troubleshooting Scenarios
Step 1:
SIP Call Errors:
- Look for responses with 4XX or 5XX codes.
- Identify retransmissions or failed sessions.
Step 2:
RTP Issues:
- Ensure both endpoints are sending and receiving RTP packets.
- Inspect for packet loss or high jitter.
Step 3:
Tracking Specific Calls:
- Use SNGREP filters to isolate a call by IP address, session ID, or time.
4.- Automation and Best Practices
- Automated Periodic Captures: Set up a cron job to run Sngrep and save captures automatically:
sngrep -N -q -l 100 -O /tmp/sngrep_$(date +%Y%m%d_%H%M%S).pcap
- Data Security: Ensure that generated PCAP files are protected, as they may contain sensitive information.
- Minimize System Impact: On busy servers, filter captured traffic to reduce resource usage
5.- Menu Options in Sngrep
Key | Function | Description |
ESC | Quit | Escape and quit sngrep. |
Enter | Show | Show more information about the highlighted line item. |
Space | Select | After pressing the spacebar, the line is selected. With this you can select multiple lines and can be used with the F2 save option. |
F1 | Help | Gives a help menu. |
F2 | Save | Option to save the current capture session dialogs to a .pcap or .txt to a specific path and file name. |
F3 | Search | Gives the option to search in a more specific and granular way. |
F4 | Extended | Gives an extended view. |
F5 | Clear | Clear the screen. |
F7 | Filter | Like search but with more options to filter the end result. |
F8 | Settings | Adjust SNGREP settings interface, capture options, call flow options, and EEP/HEP Homer options. |
F9 | Clear with Filter | Clear the screen with filter. |
F10 | Columns | Adjust what columns are displayed on the open SNGREP window. |
6.- Command Reference for Sngrep
Function | Description |
sngrep | Capture all network traffic on all interfaces. |
sngrep port 5060 | Capture only SIP traffic on the default SIP port (5060). |
sngrep -d eth0 | Capture traffic only on the specified network interface (eth0). |
sngrep -r | Start Sngrep with RTP Traffic Capture |
sngrep -O capture.pcap | Save captured traffic to a PCAP file for later analysis. |
sngrep -I capture.pcap | Read packets from pcap file instead of network devices. This option can be used with bpf filters. |
sngrep “^INVITE” | Match given expression in Messages’ payload. If one request message matches the given expression, the following messages within the same dialog will be also captured. |
sngrep host 192.168.1.100 | Capture traffic involving a specific IP address. |
sngrep -l 2000 | Change default capture limit (2000 dialogs) Limit must be a numeric value above 1 and can not be disabled. This is both security measure to avoid unlimited memory usage and also used internally in sngrep to manage hash table sizes. |
sngrep -c | Only capture dialogs starting with an INVITE request. |
7.- Some of the most common (and some uncommon) codes are given below:
400 Bad Request |
401 Unauthorised |
402 Payment Required |
403 Forbidden |
404 Not Found |
406 Not Acceptable |
407 Proxy Auth Required |
408 Timeout |
410 Gone |
480 Temporarily Unavailable |
481 Call/Transaction Does Not Exist |
484 Address Incomplete |
486 Busy Here |
488 Not Acceptable Here |
500 Server Internal Error |
502 Bad Gateway |
503 Service Unavailable |
600 Busy Everywhere |
603 Decline |
8.- Additional Resources
- Official Sngrep Documentation (https://github.com/irontec/sngrep)
- VitalPBX Wiki (https://wiki.vitalpbx.com/)
- VitalPBX Forums (https://forums.vitalpbx.org/)
With this enhanced guide, you can effectively use Sngrep to diagnose and resolve issues in your VitalPBX PBX. From real-time monitoring to exporting for external analysis, Sngrep is an essential tool to maintain your system’s quality and efficiency.

