Call Reports
Get all the information you need for the different types of calls in your call center. Measure answered calls, SLA, lost calls and abandoned calls, as well as your agents’ outgoing calls.

Create powerful reports to measure the performance of your call center queues and agents.
Sonata Stats lets you create detailed reports for your different queues and agents. Get the most information so you can measure your call center’s efficiency and take action to raise your game.
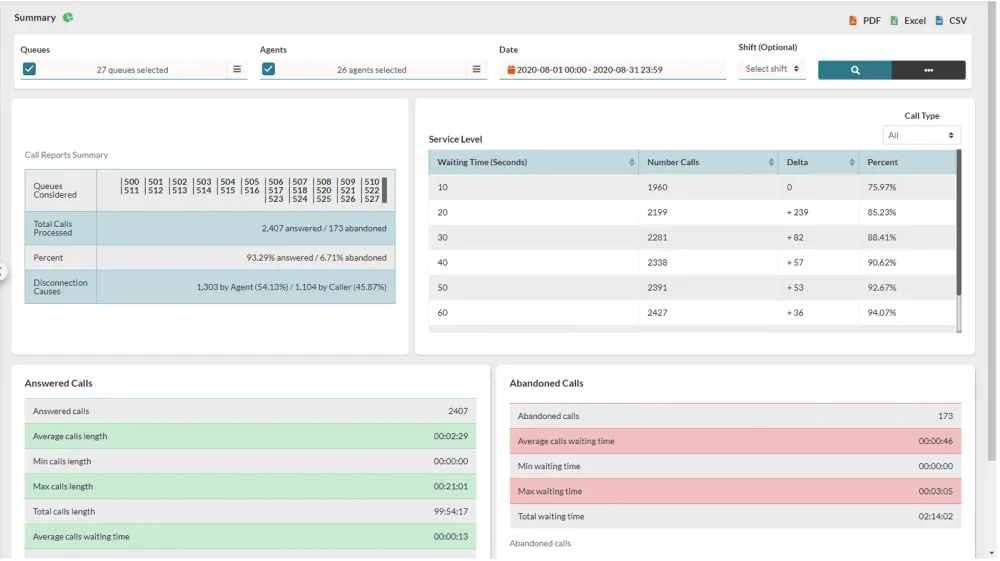
Get all the information you need for the different types of calls in your call center. Measure answered calls, SLA, lost calls and abandoned calls, as well as your agents’ outgoing calls.
Measure the number of calls your call center receives. Learn your peak hours, and the peak hours with the most lost calls.
See how well your agents are doing. Measure their sessions, pauses, availability and more, over the period you choose.
Sonata Stats turns your VitalPBX queue activity into reports your supervisors and managers can act on. Pick the queues, agents, dates and shifts, and see what happened, call by call or summed up by hour, day, day of week or month.
Real-world call centers produce noise. Callers hang up after two seconds of waiting, or the moment an agent answers. Set a short call wait limit and a short call talk limit, and those calls stop distorting your averages.
Define your work shifts, for example 8 AM to 4 PM, and reports include only the hours that matter. Limits for the longest valid pause and session keep orphan events from skewing agent figures.
Build a report once with the report builder, then schedule it to email managers on the date, time and period you choose, using your own email templates. Every report exports to PDF, Excel and CSV.
Users and roles control who sees which reports, and teams keep each supervisor focused on their own queues and agents.
What each plan includes. See the full plans comparison for every feature.
| Feature | Community | Enterprise | Call Center | Multi-Tenant | VitalPBX One |
|---|---|---|---|---|---|
| Sonata Stats | 8 Agents | 8 Agents | Unlimited | Unlimited | Unlimited |
Sonata Stats is the call center reporting and analytics module for VitalPBX. It reports on queues and agents: service level, answered, lost and abandoned calls, traffic by hour, and agent sessions, pauses and availability.
Service level is the number of calls answered within your time threshold divided by the total calls received, times 100. You choose the start, maximum and interval of the measurement, for example from 10 to 90 seconds.
Yes. Save a report in the report builder, then schedule it to be emailed on the date, time and period you choose.
Yes. Short call wait and short call talk limits leave out calls that were abandoned or hung up within seconds, so they do not distort your statistics.
The Call Center, Multi-Tenant and VitalPBX One plans include Sonata Stats for unlimited agents. The free Community plan and the Enterprise plan include it for up to 8 agents.
See which plan includes Sonata Stats, or get a personalized tour.
We use cookies and similar technologies to measure traffic, run ads and power live chat. Choose what you allow, and change it any time from Your Privacy Choices in the footer. See our Cookie Policy.
Keeps the site working and remembers this choice. Always on.
Your browser sends a Global Privacy Control signal, so Marketing starts off.
Analytics and Marketing tags load together, so they start only when both are on.